![]()
![]()
The Optics Laboratory
Group of
Hans Hallen, North Carolina State University Physics Department![]()
![]()
![]()
The Optics Laboratory
Group of
Hans Hallen, North Carolina State University Physics Department![]()
Mechanical Design
• The Mechanical Loop
• Materials
• Problem Solving
• Approach
• Fine (scanning) Motion
• Display, etc.
Hold a probe rigidly:
• How?
• What about vibrations?
• The mechanical loop.
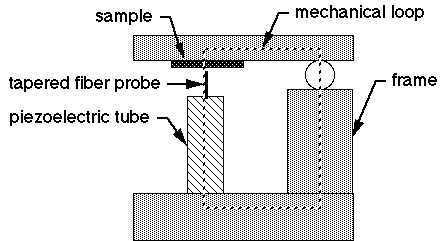
• If vibrations are to move the tip relative to the sample, they must penetrate the mechanical loop.
• Solutions
(1) keep vibrations away - vibration isolation table - acoustical isolation
(2) make mechanical resonance freq. of loop components high. - small - lightweight - stiff
(3) damp vibrations
Mechanical resonances
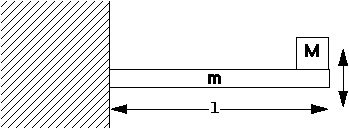
cantilever: spring constant ![]() resonance at
resonance at ![]() with E = Young's modulus and
with E = Young's modulus and ![]() with A=cross sectional area and x the direction of motion.
with A=cross sectional area and x the direction of motion.
|
|
Ti |
Quartz |
Al2O3 |
EBL#1 |
EBL#4 |
Al |
S.S. |
W |
Pb |
Oak |
|
r g/cm3 |
4.5 |
2.64 |
3.97 |
7.5 |
7.5 |
2.7 |
7.8 |
19.3 |
11.34 |
.67 - .98 |
|
E 1010Pa |
11.4 |
5.4 |
37 |
7.8 |
9.9 |
7 |
20 |
39 |
1.6 |
1.3 |
|
yield stress 107Pa |
100 |
|
0.7 - 2.2 tensile strength |
|
|
2.8 - 16.5 |
24 steel higher |
|
|
|
• references Mechanical Vibrations by Den Hartog (1956). Formulas for Stress and Strain by Raymond J. Roask (McGraw Hill, NY, 1975). A Physicist's Desk Reference edited by Herbert L. Anderson (Amer. Inst. of Physics,1989).
• How good does it have to be?
STM: want 0.01 Å noise for good STM (required for metal atomic imaging) - 0.1 Å O.K. for larger scans - want f
NSOM: less important - bigger scans less resolution. - 1Å good, 10Å may be acceptable
NSOM is 'easy' to build.
• Thermal expansion.
STM: worry -- cover, keep light off, etc
NSOM: again, larger scans and less resolution make it less important. - most NSOMs are 'out in the wind'
design: symmetry so uniform thermal expansion is canceled. - problem: usually temp. change is not uniform. - never a problem at low temps.
• Materials
- Macor is machinable, light, stiff, and has an expansion coefficient similar to PZT (piezoelectric material used).
- Titanium is also good.
- Aluminum is light but rather soft.
- Stainless steel is good but dense.
- Ceramics are good but hard to shape.
- Sapphire is very hard and flat.
- shock-absorbing rubber, bungie-cords
• Isolate the cause
- by turning off nearby (upstairs, downstairs, and neighbors) equipment one at a time, watching for improvement.
- by shutting off parts of the NSOM to find what it couples to.
- by spectrum analyzing the noise.
• Understand the cause.
- Peaks from mechanical resonances are estimated using above equations
- 60 Hz is often from ground loops or stray light.
- Loaded motors run just under 60 Hz. Other building vibrations < ~100Hz.
- RF is from computer or lock-in.
- Vibrations can couple acoustically or through the floor.
• Fix it.
- Shut off the noise source.
- Isolate at the source (motors on spring and rubber mounts).
- Isolate at the instrument: weighted curtains, air table, shields.
- Re-design instrument.
- Cluge like crazy: sand, damping rubber, heavy weight (spring-mass- spring), etc...
• Known trouble spots.
- Glue joints (especially at the tip).
- Coarse adjusting screws (nuts should be tight, tips run smooth and true).
- Incoming wires and cables: clamp in two places to a heavy, stable object.
- Ground loops.
- Bad probe tips/dirty sample (don't blame the machine).
Coarse approach of the tip to the sample
• Almost all NSOM microscopes use 1/4-80 screws for the coarse approach.
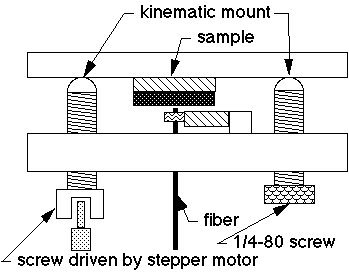
• The screws have balls at the end which mount into a kinematic mount for the sample stage.
• One screw is driven by a stepper motor to automate the approach.
• Other types of approach mechanisms are sometimes used in STM's.
A Constant Velocity Linear Motion Stage
Drive Voltages
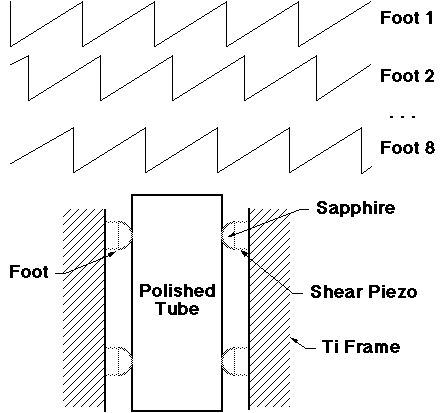
The feet are driven out of phase so at least seven are always moving. The other foot slips. The tube is supported solely by the eight feet.
Driving Waveform for Stick-Slip Motion
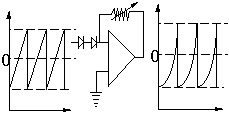
A simple circuit to generate the sharp waveforms necessary for producing slip-stick motion is shown. A ramp waveform from a function generator triggered by a computer passes through a nonlinear amplifier circuit (consisting of two diodes, an op-amp and a variable resistor) and is then passed through a high voltage amplifier (not shown) before being applied to the piezo's to generate the slip stick coarse motion.
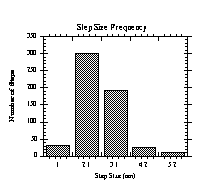
A histogram of the frequency of the step size for several hundred steps.
Scanning of the sample (or probe):
• Most NSOM's (and other probe microscopes) used tubes with the electrodes cut along the length.
• Usually 4 sections, although 3 and 6 are found.
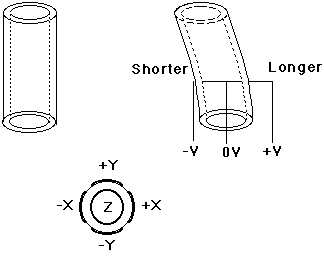
• To understand, consider a plate piezo.
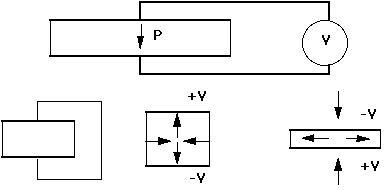
• The lateral size change is governed by the d
31 piezoelectric coefficient.
Calibration of the scanning displacements.
• theoretical estimate:
- The length change on either side is a function of the length l, wall thickness t, voltage V, and the d31 coefficient. ![]() .
.
- We assume the strain is evenly distributed, then the two sides form arcs of circles with radii differing by the tube width w.
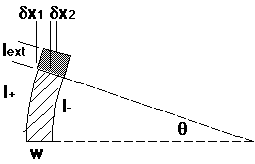
- It then follows that the sideways displacement of the top of the tube is ![]()
- similarly, the angle from normal of the upper face of the tube is ![]()
- This means that if an extension of length l
ext is mounted on the end of the tube (for, e.g. a sample mount), its top will move to the side- The total motion is then ![]() .
.
• The motion can also be calibrated by measurements.
- These methods can rely on sensing the motion of the tip with an external instrument: an interferometer (accurate) a very precise dial gauge (these exist with < 1 Ám resolution) capacitance gauges (accurate) optical microscope (crude, but O.K. for very large range)
- Other methods use the probe on a well - characterized sample: latex spheres (come in a variety of sizes) C (graphite) or Au on mica work if you mount an STM tip. structures produced by precision electron beam lithography. (this is perhaps the most accurate)
Problems with piezo's (PZT ceramics)
- These are usually made by sintering, then poled at high voltages -- they are not nice single crystals.
• hysteresis (history dependence of position)

- hysteresis is controlled by either measuring the shape of the curve and compensating, or more accurately (and rarely) by in-situ capacitance sensors of position (Joe Griffith, Phil Russell, et al.).
- It can be ignored if the scans are not very large and data is stored separately for scanning in opposite directions.
• creep (after a voltage step, the motion does not come to an immediate stop but the motion falls exponentially to zero).
- Creep is worst after large voltage steps, and appears as a drift in the image (as that from thermal deformations of the microscope).
- It is minimized by waiting a few minutes after large voltage steps.
- Creep does not occur at cryogenic temps.
• Distortion due to the path the probe takes not being exactly a plane (pin-cushion distortion) can be a problem on instruments with very large scan ranges. - Correct by calculating and pre-compensating.
Computer scanning / data taking
- This is routine -- a computer (through DACs) drives high voltage amplifiers (+/-150, +/-220 or +/-600 V), usually high voltage op-amps wired in an inverting gain configuration.
- It works better if the steps between data taking locations are covered in several smaller jumps rather than one big one:

so the feedback can remain closer to the setpoint value (remember the linear approx).
Scanning Configurations:
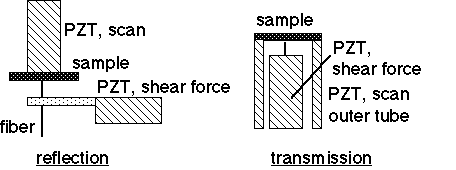
• There is nothing unique about these configurations.
• An instrument that does both (A. LaRosa):
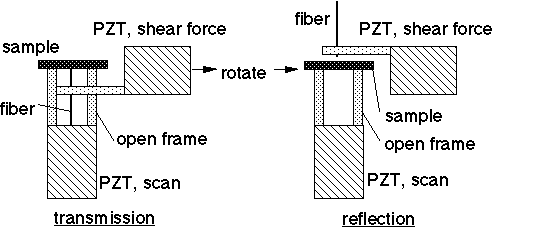
Massaging Data
• Background subtraction
- Helps to show contrast
- The only data handling you ought to need.
- Line by line Sometimes used but can distort images.

- Least squares fit to all or part of an image. Recommended.
• Spike (glitch) removal.
- Occasionally data may contain one bad point for a variety of reasons.

- It is often replaced with an average of the neighboring points.
• Smoothing
- Mild: multiply by .25 .5 .25 in a sliding average, in both directions.
- FFT: cut out whatever frequencies are not desired.
• Our recommendation:
- If the data needs much massaging, throw it out and take better data.
- Don't rely on heavy filtering -- you want to know if your data is trustworthy or not.
- Commercial instrument users: know how your data is being filtered.
- Filter data as you take it -- analog or averaging. There is no reason why you should use a wide bandwidth with slow sampling. But leave enough time constants between data points so that you do not smear the data. Also take a look at the unfiltered signals to be sure it is just white noise (no sample bumping or oscillations which could signal trouble).
Display
• Many modes, generally fall into two categories.
- view from directly above Image is seen through the color (gray) scale.
- Perspective -- Usually the z in topography is greatly exaggerated over x and y. An optical image doesn't even have the same units.
• Color by
- gray scale / color by data range (color bar).
- light source (good when fine contrast within several regions separated by large contrast).
- derivative coloring.
- Overlay several images, giving each its own primary color -- to show correlations.
- You learn more about this by going to the instrument show.
• Color bars.
- Uniform range of colors:
- Non-uniform color gradient Used to highlight part of the image. Also used to hide spiked noise. Be suspicious if you see large areas of endpoint colors or randomly spaced dots of them -- it may be hiding bad data.
![]()
North Carolina State University | Physics | Optics Home
Last updated on September 27, 2000