![]()
![]()
The Optics Laboratory
Group of
Hans Hallen, North Carolina State University Physics Department![]()
The Electric Field Near an NSOM Probe Tip
The electric field near an NSOM tip has been studied by many researchers, but the simplest form of the theory dates back decades to Hans Bethe, with a slight correction by Bouwkamp, who calculated the fields near a thin, perfectly conducting, flat sheet with an aperture in it. This is not exactly what we have experimentally – we have an aperture at the end of a pointed structure, but the metal is often thicker than the aperture size. Furthermore, the model has been found to fit single molecule (Betzig et al.) and Raman (our work) data very well. We describe this model here with a few examples.
The Bethe-Bouwkamp solution uses oblate-spheroidal coordinates (u,v,
f) defined by![]() ,
,
where (x,y,z) are the usual cartesian coordinates. The electric field components are given by:
![]() ,
,
![]() , and
, and
![]() ,
,
for incident x-polarized light through an aperture of radius a.
We plot these fields for various distances from the aperture:
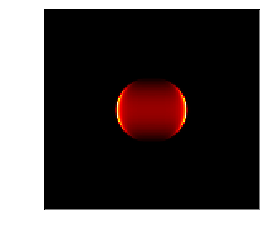
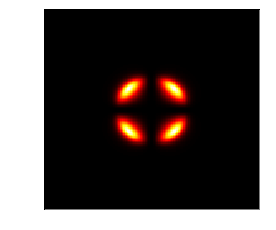
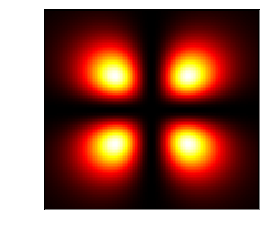
This is 1/100 a above the aperture, showing a region 3a on a side. The data have been scaled. Ey is much smaller than the other two. On the left is Ex^2, center Ey^2, and right Ez^2. One can clearly see the outline of the aperture in the figures. Ex and Ey lie within the aperture, and Ez lies on the outside, under the metal. This behavior is clear when one considers the boundary conditions for electric field near a metal surface: there can be no electric field in the plane of the surface (no Ex or Ey over the metal here), but electric field is allowed normal to the surface (Ez O.K. over metal here). The situation within the aperture is different: now the metal is on the edges only, so Ex and Ey but not Ez can be near the edges. Anything can be in the middle according to the selection rules, but only Ex has the source (input light).
Further from the aperture, diffraction has spread the light (and reduced the intensity).
 .
.
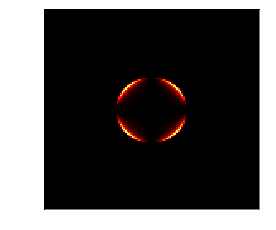
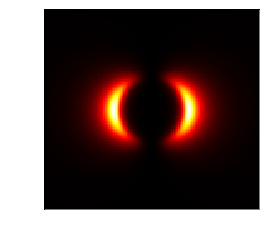
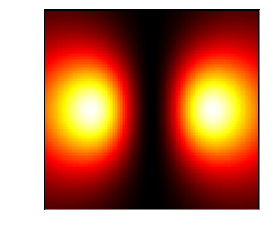
This is 1/10 a above the aperture, a typical NSOM scan height, showing a region 3a on a side. The data have been scaled. Ey is much smaller than the other two. On the left is Ex^2, center Ey^2, and right Ez^2.
A drop in resolution is evident by the time the tip is an aperture size a above the surface:
 .
.
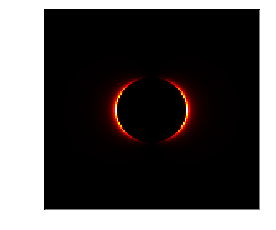
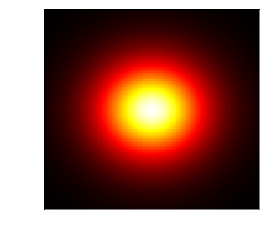
This is 1 a above the aperture, showing a region 3a on a side. The data have been scaled. Ey is much smaller than the other two. On the left is Ex^2, center Ey^2, and right Ez^2.
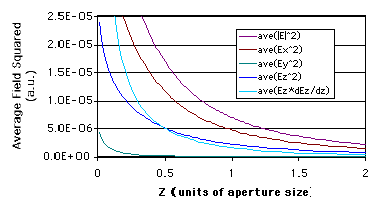
To compare quantitatively to measured spectroscopic data, it is usually useful to average over these images, as the spectroscopy does, and plot one point for each z-height. This is done below:
 .
.
Independent calculation of the components is meaningful, since the spectroscopy usually couples to a particular bond, and the bond can have a fixed position (for a crystal or oriented molecules). The squares of the projected fields appear in the intensity, so they are shown. The plot with the derivative of Ez is what is expected in gradient field Raman, for comparison.
The increase in electric field as one approaches the surface has two causes: one is the natural decrease as 1/z^2 for propagating electric fields at large distances from the aperture (not true at short distances). The other is the presence of non-propagating, or evanescent, modes near the aperture. These are present to insure that the metal boundary conditions are met, and come out of the equations used.
![]()
NC State University | Physics | Optics Home
Last updated on September 29, 2000
Copyright ©2000, Hallen Laboratory, NCSU, Raleigh, NC. www.physics.ncsu.edu/optics
Comments or questions? Hans_Hallen@ncsu.edu