![]()
![]()
![]()
![]()
The Optics Laboratory
Group of
Hans Hallen, North Carolina State University Physics Department![]()
Signal Processing for YBCO Oxygen Changes During EM
The oxygen content variations in the native YBCO make the quantitative analysis of the changes due to electromigration difficult. We therefore use a signal processing scheme to automate the process of subtraction of the two images so that the difference (due to electromigration) is clearly evident.
We use a correlation-based method since the instrument has generally drifted in the time between the two images. We do the correlation on the topographic images so that the measurement is independent of the optical changes, but in practice, the correlation of the optical images directly gives image shifts that are the same to within one pixel of those given using the topographic images.
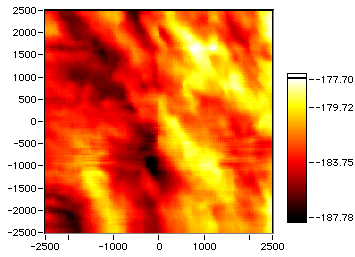
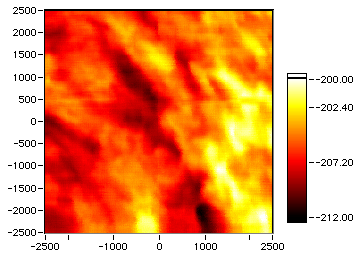
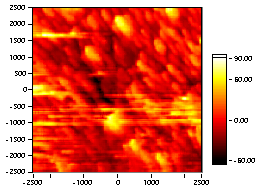
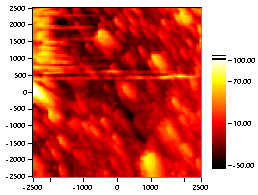
To illustrate the problem, the image on the left was taken before electromigration, and that on the right after electromigration:
 ,
,
with the corresponding topographies:
 .
.
A careful study will indicate that the right image is shifted down and to the right from the region in image on the left. The 2-dimensional correlation between the topographies was calculated. The (j,k) correlation point is given by shifting one image by j points in x and k points in y, multiplying the two images, and summing, or by multiplying the Fourier transforms and inverting back to real space. Proper zero-padding must be used with the Fourier technique. The correlation should be corrected for the number of overlapping points at each shift. The shift (bright spot) is very obvious in the correlation:
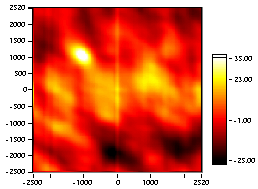
The drift rate for this image shift corresponds to 260 nm/hour. This drift is used to automatically align the optical images for subtraction. When we do the subtraction of the optical images, we obtain the following image:
The size of the image is smaller, since it results from the overlap of the regions in the two images. The electromigrated region (near the center at the top) is now clearly evident, and quantitative analysis of the size and location is possible.
For best results, we found that the images used should be unprocessed, raw data. Any type of smoothing or background subtraction tended to yield poor correlations and/or poor difference images.
![]()
![]()
Last updated on October 5, 2000